
If you are the one who gets the complaints about stuffy air, too hot or too dry, and you would like to answer with something more solid than a hunch, read on.
Indoor climate is the physical conditions in a room while there are people in it: how warm it is, how humid the air is, and how used up that air is. The three are measured as temperature in degrees, relative humidity as a percentage and CO2 in ppm. It is not the building’s energy rating, and it is not the same as the building having met the rules when it was designed. Indoor climate is how the room behaves at two o’clock on a Tuesday, when the sun has been on the façade since lunch and the meeting room has been full for three hours.
That is why two rooms in the same building can have completely different indoor climates. One faces north, the other gets the afternoon sun. One holds three people, the other twelve. When the complaint lands on your desk, the question is rarely whether the building was approved. It is what happened in that particular room, during those particular hours.
The three numbers that carry the conversation
When you measure with our solution RoomAlyzer Air, you get numbers that document the actual indoor climate in black and white.
-
Temperature: Decides whether the room is workable. The body notices both too cold and too warm, and what feels right in January is often too cool in July. In an ordinary office the green zone typically sits at 22–26 °C in summer and a couple of degrees lower in winter. That is not a legal requirement for your Tuesday — it is a comfort band your team can stay inside and measure against.
-
Relative humidity: Tells you how dry or damp the air is, measured as a percentage of what the air can hold at the current temperature. Below around 30 %RH the air feels dry: dry eyes, dry throat, static in your hair. Above around 70 %RH the risk of condensation on cold surfaces rises, and with it the risk of mould. In an office the green zone typically sits at 35–65 %RH. Note the word relative: the same amount of water in the air looks drier once the room warms up, and that is exactly why the air turns dry in winter.
-
CO2: Tells you whether the air is being changed at the same rate as people fill the room. Outdoor air sits at around 420 ppm. Below 800 ppm the air change is keeping up. Between 800 and 1,200 ppm the air is getting used. Above 1,200 ppm the room is genuinely under-ventilated. CO2 is not dangerous at the levels you meet in an ordinary room — it is an indicator that everything else building up in used air is not being aired out either.
Alongside the three there are VOCs (chemical vapours from paint, furniture and cleaning products), sound and light. They are part of the indoor climate too, but the first three are what the complaints and the standards are about.
A good indoor climate is a band, not a single number
What counts as good depends on what the room is used for. A school classroom, an open-plan office and a museum store make different demands — and the same room makes different demands in summer and in winter.
The common European language for this is EN 16798-1, which the Building Regulations also lean on. The standard works with comfort categories: category I (high comfort, typically for vulnerable groups), category II (the norm for new and refurbished buildings) and category III (an acceptable minimum in existing stock). The categories are design targets. They are not a stamp anyone has hung on the door.
In practice that means two things for you: you need to know which band applies to the room, and you need to be able to see whether the hours the room was actually in use fell inside that band. A single reading on a Wednesday morning in an empty room tells you almost nothing.
How to see it without guessing
The sensors sit in the occupied zone — where the people are — and measure continuously. In the Indoor climate module in RoomAlyzer Air you decide for yourself how closely you want to follow along.
The sensor list is the starting page. The hierarchy follows your buildings and rooms, and every sensor shows live temperature, humidity and CO2. Clicking a value opens a quick chart for the past 24 hours, so you can see straight away whether the complaint matches a pattern or a single hour.
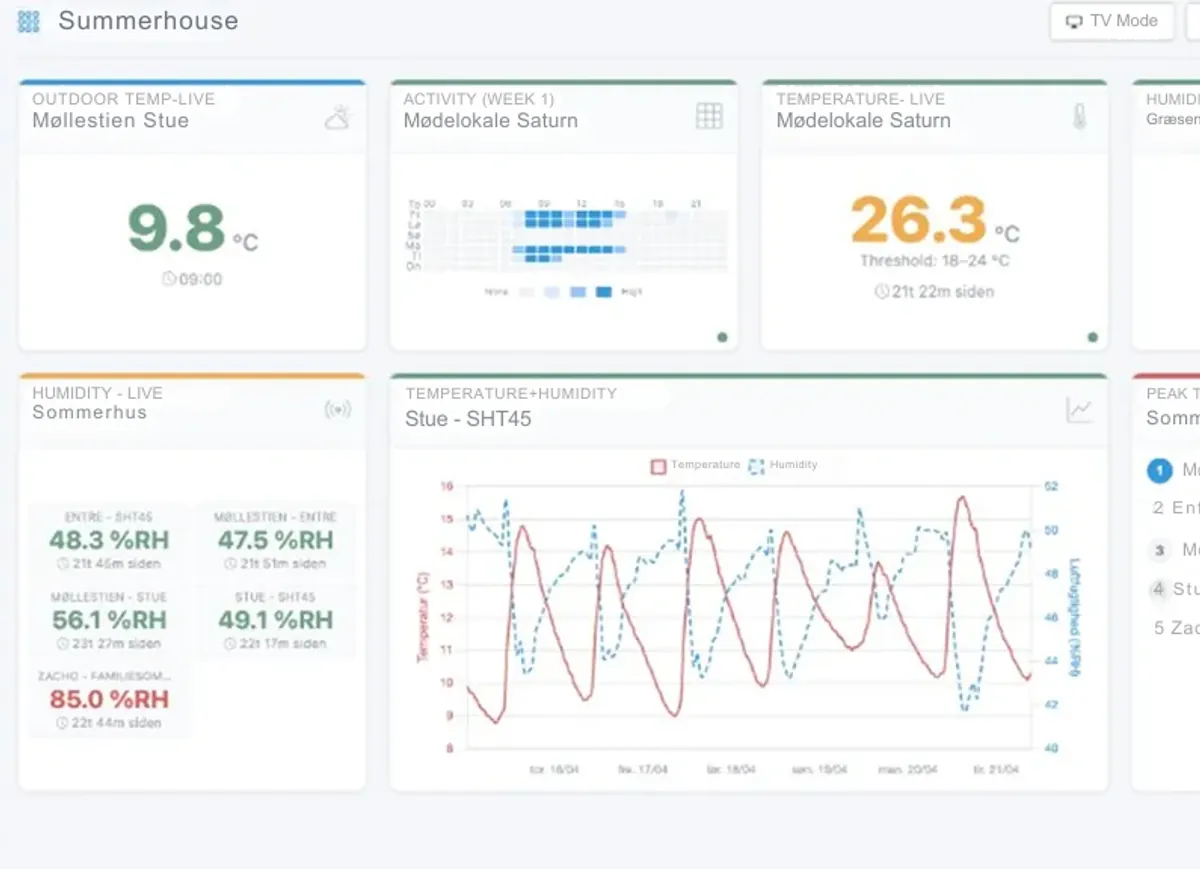
The dashboard gathers the rooms you want to keep an eye on as widgets: a key figure, a chart, a heatmap or a top list of the highest values right now. It can be sent to a screen in the canteen or reception over a TV link.
Map and floor plan colour each room by the parameter you choose, so a whole floor can be read at a glance — with the value shown as a small pill right where the sensor actually sits.
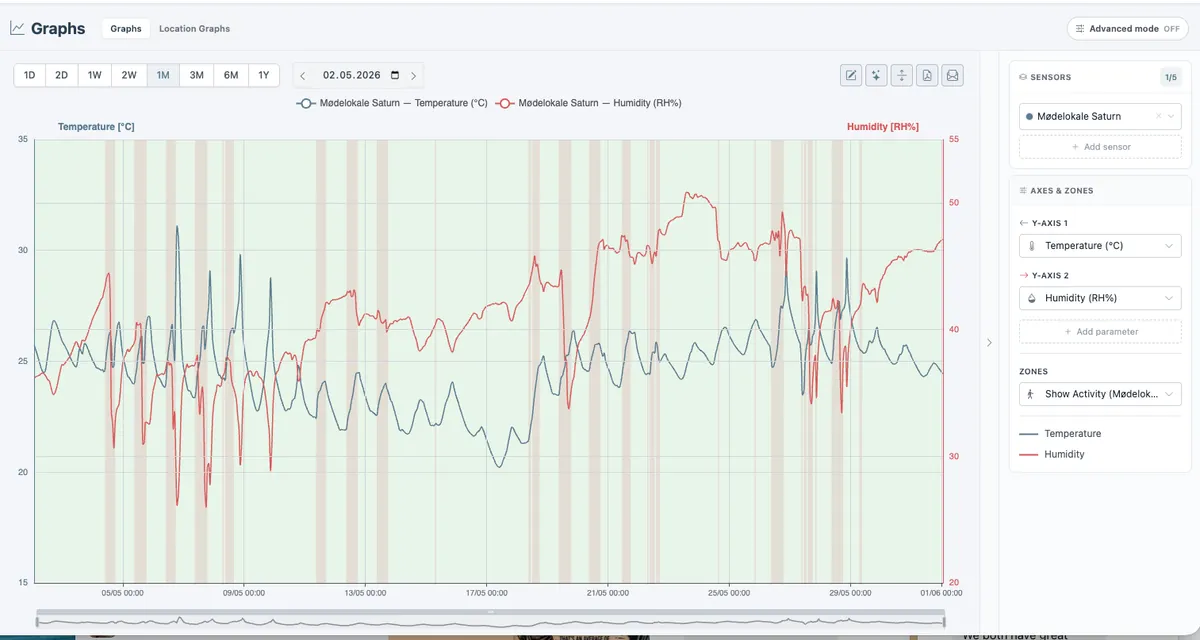
The charts draw the curve over days or months with green, amber and red zones behind it, so a breach is visible before you have to explain it.
The colours do not come from nowhere. Under Administration → Thresholds you assign the room a scenario: a ready-made set of thresholds that suits the room type, switching between summer and winter. Which sets are ready, and when the season changes, is in scenarios and thresholds.
And if you would rather not look yourself: notifications send an email or a text message when a room crosses its threshold. Afterwards, Deviations shows how much of the time each room spent in the green, amber and red zones — and which rooms are the worst.
What changes once the indoor climate is measured
The gain is not that you have more numbers. It is that the conversation changes subject. Instead of ‘it’s stuffy in here’ it becomes: ‘meeting room 3.12 goes above 1,200 ppm every Tuesday after lunch, and the temperature follows the sun on the west façade from one o’clock.’ Then facilities, the person who complained and the person who has to pay for the fix are all looking at the same sequence of events.
And when someone asks for documentation — the health and safety representative, senior management, the parents’ committee, an auditor — the series is already there. The location report gathers one address into a single PDF, which you either download now or have sent to you automatically every Monday morning. For certification and EU requirements there are dedicated DGNB and EPBD reports that hold the measurements up against the comfort categories.
Be honest about what this is: operational monitoring. We do not certify the building, and we do not replace a building survey or a regulator. We show how the occupied zone behaved while it was in use — and that is usually exactly the question under discussion.
If it is the air in particular that is causing trouble, CO2 monitoring with sensors is the next step. If you need to get the bands themselves right, scenarios and thresholds is the place to start.