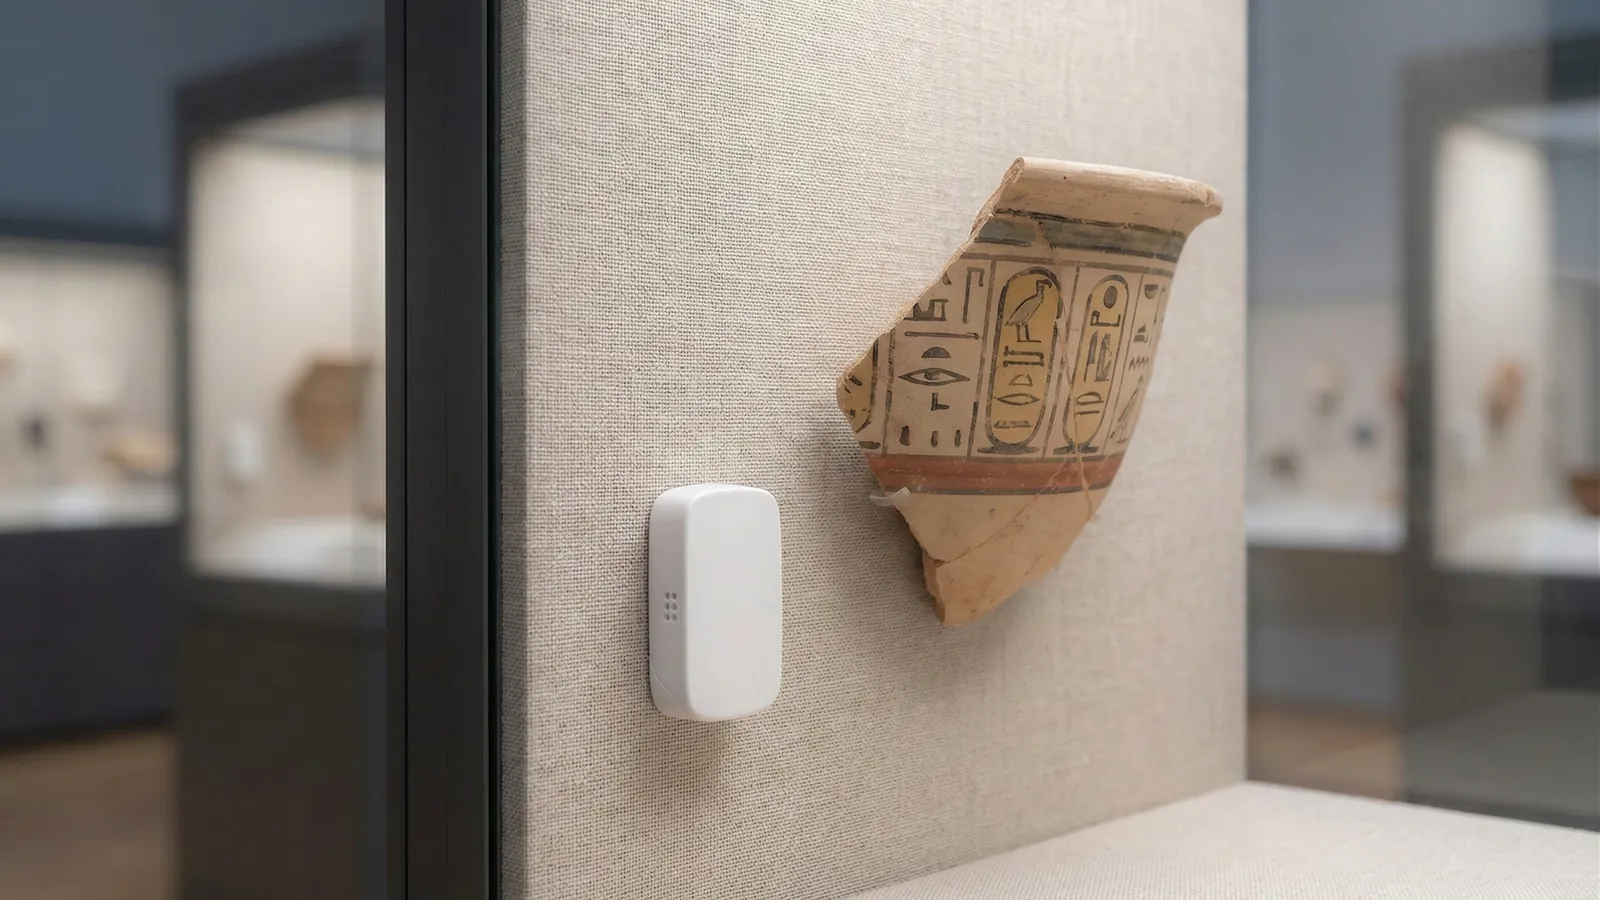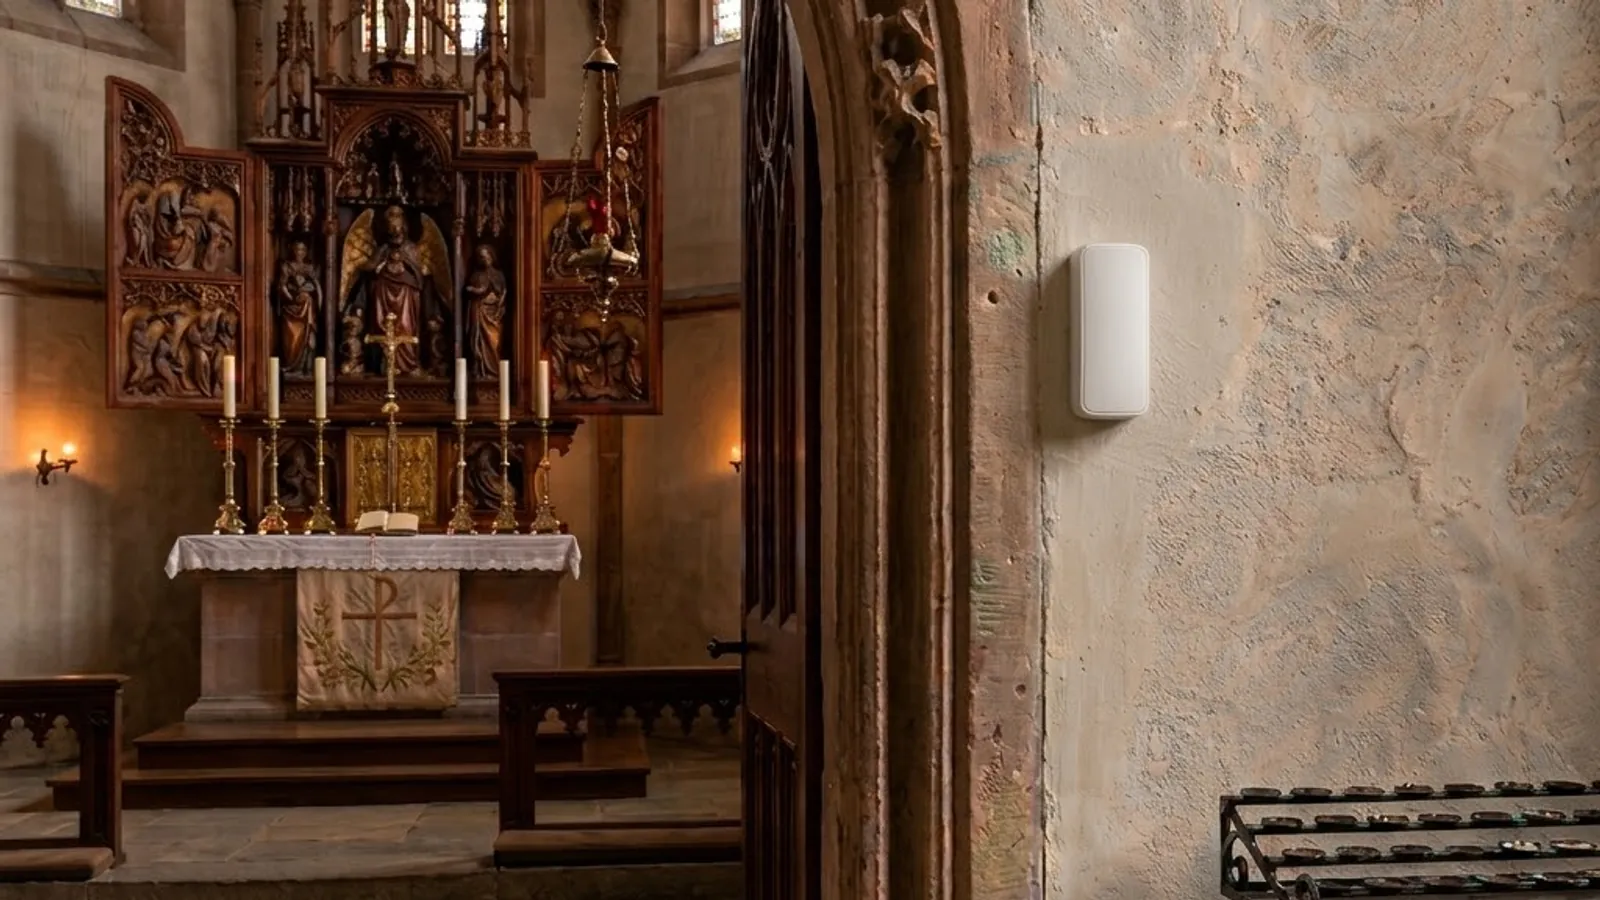
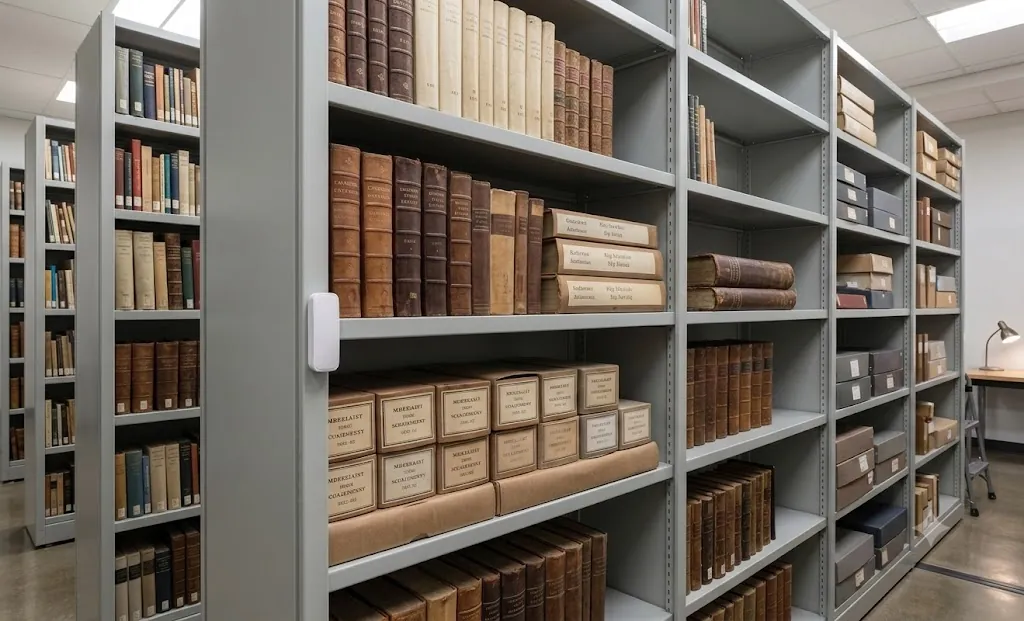
If you are the one responsible for a museum store, an exhibition, a church or an archive, you need data that tells you how the indoor climate is affecting the building and the objects inside it. You also need to know more than that the humidity is 52% — that figure on its own says nothing about whether the collection is doing well.
Preservation monitoring is the continuous measurement of temperature and relative humidity, translated into the language preservation actually speaks: how quickly the materials degrade, whether the climate supports mould, whether the fluctuations are larger than the objects can take, and how the room performs against the international climate standards. In Preservation in RoomAlyzer Air that translation happens in six analyses, all built on the same two readings. That includes basements, crypts and remote locations.
Why two figures are not enough
A sensor reports 52% and 19 degrees. That is true, but it does not tell you whether it is good.
For preservation the answer depends on what is standing in the room, how long the climate has been like that, and how much it moves. Paper and parchment degrade chemically, and the rate depends on both temperature and humidity over time. Wood and paintings take mechanical damage from rapid shifts, not from a stable level a few per cent off the ideal. Mould needs moisture and time in combination. And an object that has stood in the same room for eighty years is acclimatised to that particular room — an abrupt ‘improvement’ can do more damage than the climate it is used to.
A single snapshot therefore means nothing for preservation. Time is the variable.
The six analyses
-
Preservation Index (PI and TWPI): Translates temperature and humidity into preservation-equivalent years: how many years pass before unstable organic materials show noticeable degradation under the current climate. Higher is better. Above 500 years is excellent and belongs to cold storage; 150–300 is very good for watercolours, parchment and textiles; 75–150 covers most museum collections with oil paintings, wood, leather and books; 45–75 is risky for unstable materials, and below 45 only inorganic materials are safe.
The figure the room is judged on is the TWPI over one year — the time-weighted average — precisely because a single hour says almost nothing about preservation. ‘PI right now’ is still shown, but as a secondary figure with no status of its own. Next to it sits the TWPI for the past month, and the difference between the two is the trend: if the past month is better than the year, things are moving the right way.
-
Mould risk (VTT): Works out whether the climate supports mould over time. The index and the scale are in mould risk under VTT.
-
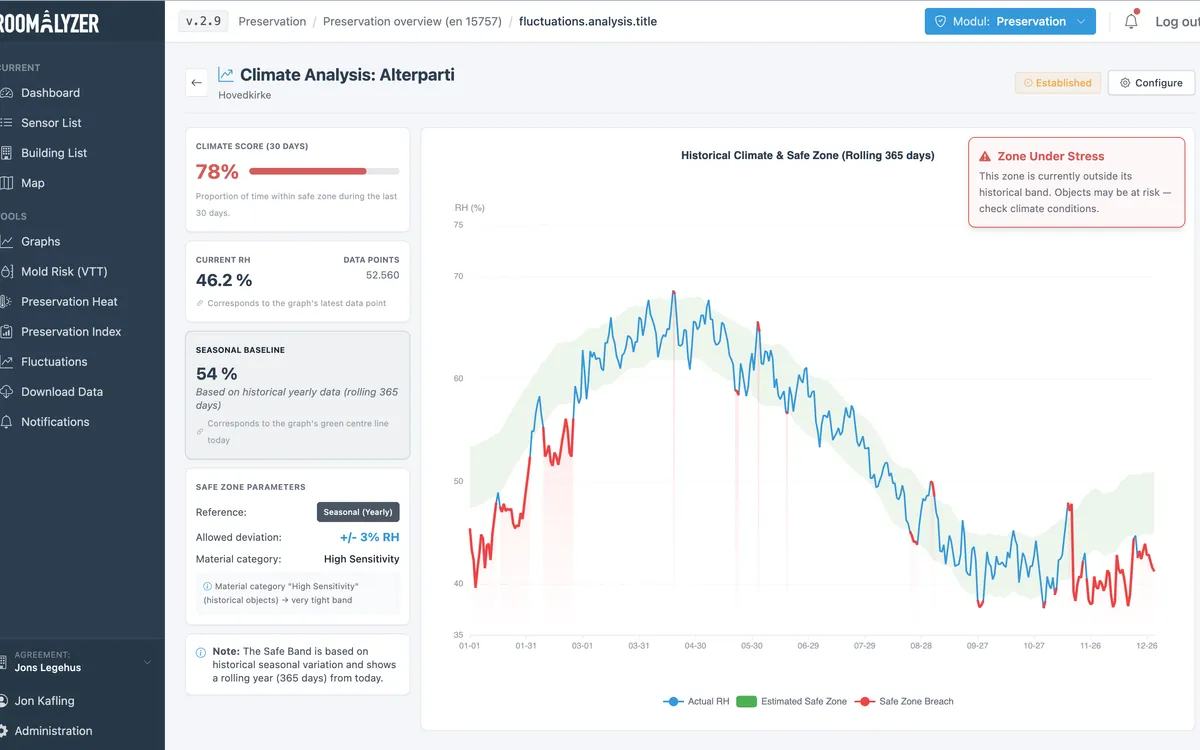
Fluctuations (EN 15757): Looks at whether the humidity stays within a band derived from the room’s own historical climate. It is the swings, not the level, that cause cracking and flaking in organic materials.
-
ASHRAE climate classes: Give the room an overall grade from AA to D under ASHRAE chapter 24. That takes twelve months of hourly readings and at least around 8,000 valid hours, and a class only counts as achieved when at least 99.5% of the hours fall inside the class band for both temperature and humidity. It is a strict yardstick, and that is the point.
-
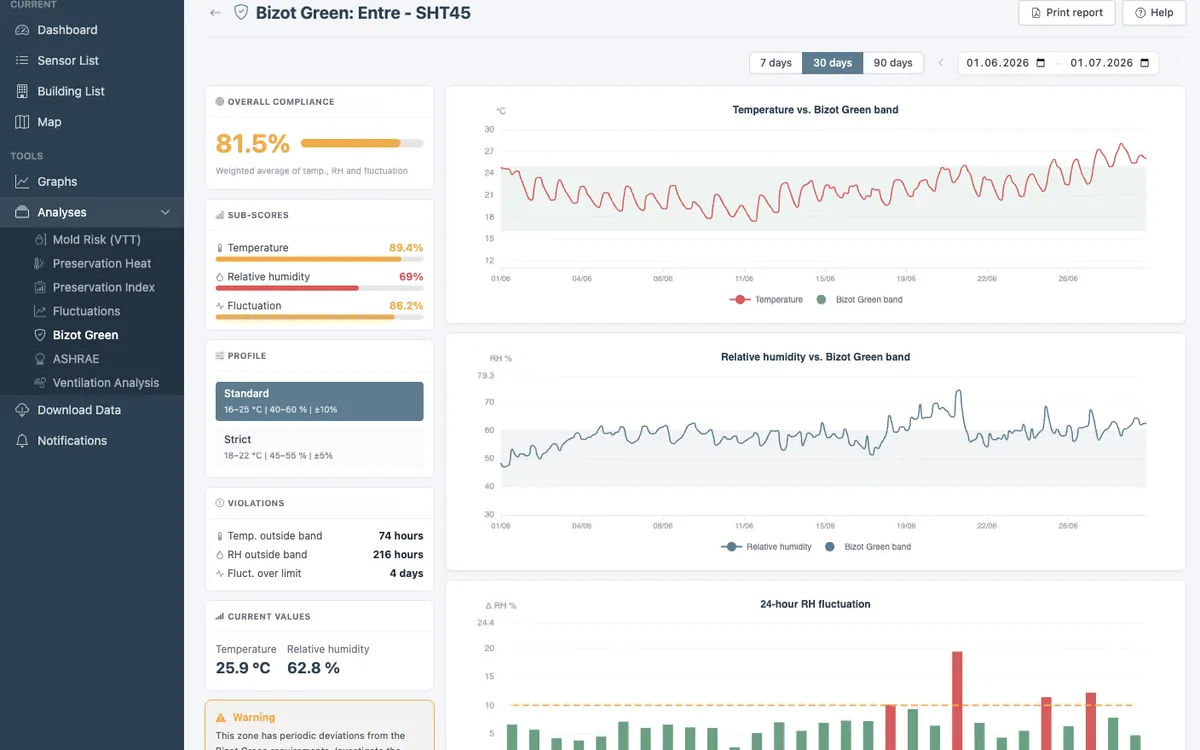
Bizot Green: Measures against the climate guidelines the directors of the major art museums have agreed on: 16–25 °C, 40–60 %RH and no more than ±10 percentage points of humidity movement over 24 hours. The thinking behind it is that wider but stable bands preserve safely at far lower energy use than a narrow, tightly controlled climate. For sensitive collections there is a tightened profile of 18–22 °C, 45–55 %RH and ±5 percentage points. Compliance is calculated as the share of time inside the bands: above 95% is compliant, 80–94% is a warning, below 80% calls for action.
-
Heating waste: Turns the focus to energy: what it costs to keep the room warmer than preservation requires.
How it is used in practice
All six analyses have their own page in RoomAlyzer Air with charts and explanations, but day to day the work happens in three places.
-
The sensor list: Shows the mould index and TWPI over one year as fixed columns next to temperature and humidity, so you can scan a whole building at a glance.
-
The building list: Is the fleet view for those of you with many addresses: one dot per location on a map, coloured by criteria you set yourselves. The default is relative humidity between 45 and 70%, but you can add criteria for TWPI, mould, fluctuations, ASHRAE, Bizot or heating waste. The filters only colour — nothing is hidden — so you can see how many sites fall outside what you want without losing the overview.
-
The dashboard: Gathers status tiles for the tools you follow most closely, and can be sent to a screen over a TV link. The Preservation overview tile shows all six at once for a single sensor.
When someone needs it in writing, the preservation report brings a location or a single sensor together in one PDF with temperature and humidity charts plus the analyses that are relevant. It can be downloaded straight away or sent automatically every month.
Archivstelle Sigmaringen runs this across decentralised parish archives: humidity limits are set per room, and an SMS or email goes out the moment a reading leaves them.
A detail that has saved many false conclusions
The preservation figures use fixed windows: TWPI is calculated over one year, EN 15757 over the preceding year, ASHRAE over one year, Bizot over 90 days. If a sensor has been moved to another room inside such a window, the figure describes neither the old room nor the new one — but it looks just as authoritative as a real one.
That is why the report stops if the period spans a sensor move, and tells you which sensors were moved and when. You can then shorten the period, leave the sensors out, or include them anyway, in which case the report carries a warning printed at the top. It is a small thing that prevents the worst kind of error: a neat report that is wrong.
If you want to dig into the mould model, mould risk under VTT is explained here. If it is the fluctuations that worry you, EN 15757 is explained here.