For anyone who has found a patch in one corner and is now wondering how many other rooms are heading the same way, with nothing visible yet.
Mould risk under the VTT model is a calculation that turns temperature, relative humidity and the sensitivity of the material into a mould index from 0 to 6. The model was developed by the Finnish research centre VTT and is the most widely used mathematical model for predicting mould growth on building materials. The point of it is the timing: the index rises while the growth is still microscopic, weeks before anything can be seen with the naked eye.
Why ‘the humidity is high’ is not a usable answer
With our solution Preservation in RoomAlyzer Air you can prevent mould damage using simple wireless sensors that give you clear overviews and warnings in good time.
Everyone knows high humidity is bad. The problem is that on its own it does not tell you when to act.
Mould needs three things at once: moisture, nutrients and time. A single damp day makes no difference, because the fungus does not have time to establish itself. A winter at 78% in an unheated room, on the other hand, can be enough. Temperature plays its part too — growth is faster at 20 degrees than at 8 — and the material decides how easily it happens: untreated wood and paper are far more vulnerable than a tile.
The VTT model in RoomAlyzer Air brings exactly those factors together over time. The index is therefore not a measure of how damp it is right now, but of how far the climate has taken the room towards growth.
The scale — and what to do at each step
| Index | Meaning | What it calls for |
|---|---|---|
| 0–1 | No growth detected. The climate is safe | Carry on |
| 1–3 | Microscopic growth — the spores are active but invisible | The early warning. Look at ventilation and humidity level |
| 3–6 | Conditions for visible growth have been present | Physical inspection of the room |
The middle band is what the feature exists for. When the index reads 2.3 and rising and the humidity sits above 80%, there is nothing to see yet — but the climate is working actively against you. Bringing the humidity below 75% for a couple of weeks will usually turn the trend around, and that is far cheaper than remediation afterwards.
Note that the trend matters as much as the figure. A steady index of 2 in a room with even humidity around 70% is a different thing from an index of 2 that has climbed from 0.8 in three weeks. The system therefore shows both value and direction: rising, steady or falling.
The material class decides the result
The model cannot calculate without knowing what the surface is made of. That is why every sensor has a material class:
| Class | Sensitivity | Examples |
|---|---|---|
| SQ1 | Very sensitive | Untreated pine and spruce, paper and card, organic insulation materials — and canvas, textile, costumes, leather, unpainted wood sculpture |
| SQ2 | Sensitive | Planed timber, plywood, MDF, plasterboard — and painted or varnished wood, furniture, picture frames |
| SQ3 | Medium | Concrete, brick, lime plaster, mineral wool — and porous natural stone, plaster casts, terracotta |
| SQ4 | Robust | Glass, metal, ceramic tiles, glazed ceramics, porcelain, polished stone |
Every sensor measuring both temperature and humidity is given SQ2 automatically. That is a deliberate choice of a sensible starting point rather than requiring someone to register each sensor by hand. The class is changed under Administration → Mould VTT if the room holds something more vulnerable.
Two things are worth keeping track of. The classes are calibrated on building materials, but they describe the nutrients and porosity of the surface — so they cover organic surfaces on objects as well. There is no separate class for museum objects in the standard. And stone is not simply stone: porous sandstone and limestone take up moisture and belong in SQ3, while polished or dense stone is SQ4.
The rule of thumb: choose the most vulnerable surface within four or five metres of the sensor — building surfaces and objects alike. If in doubt, choose SQ1. That gives you the most cautious assessment.
How you see it
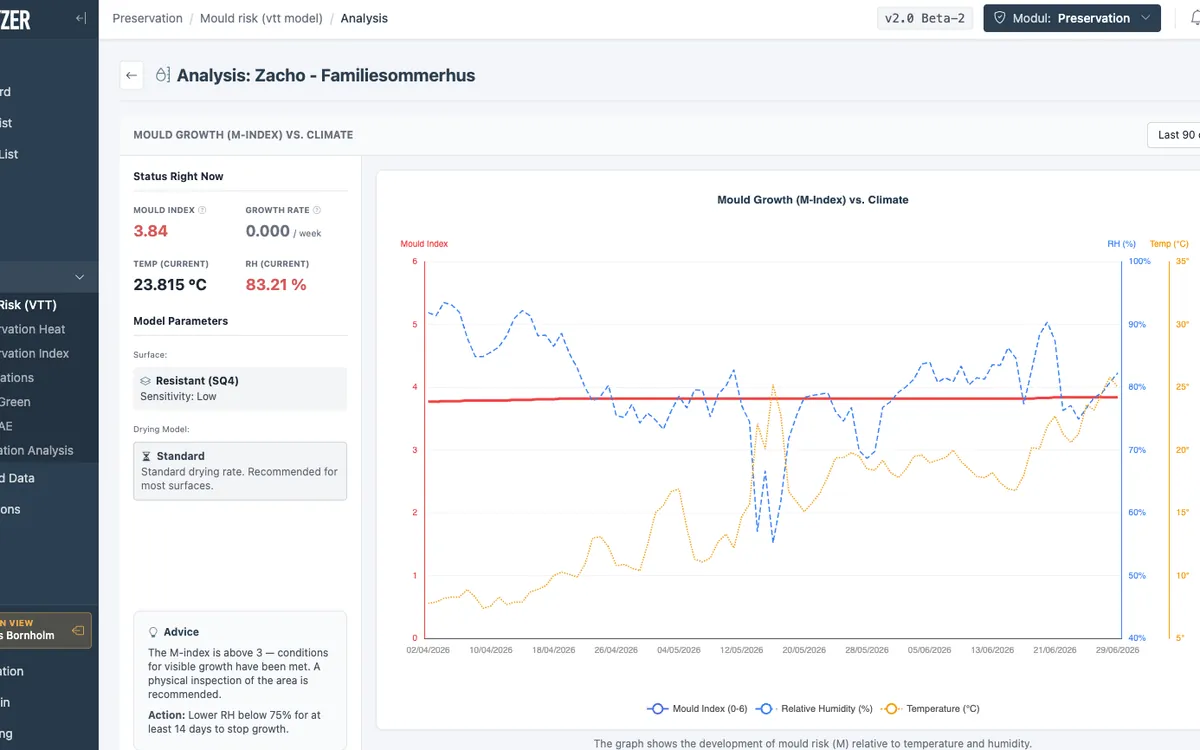
We know that those of you working in operations are often pressed for time, so we have made this genuinely easy to grasp inside RoomAlyzer Air. The overview page under Preservation → Analyses → Mould lists every sensor with its index, status, trend and material class, with headline figures at the top for the highest index, the number of zones with growth under way and the active sensors. A dash instead of a figure means the calculation is still running in the background — the page refreshes itself after a few seconds. That is not the same as ‘no mould’, and it is worth remembering in the reports too.
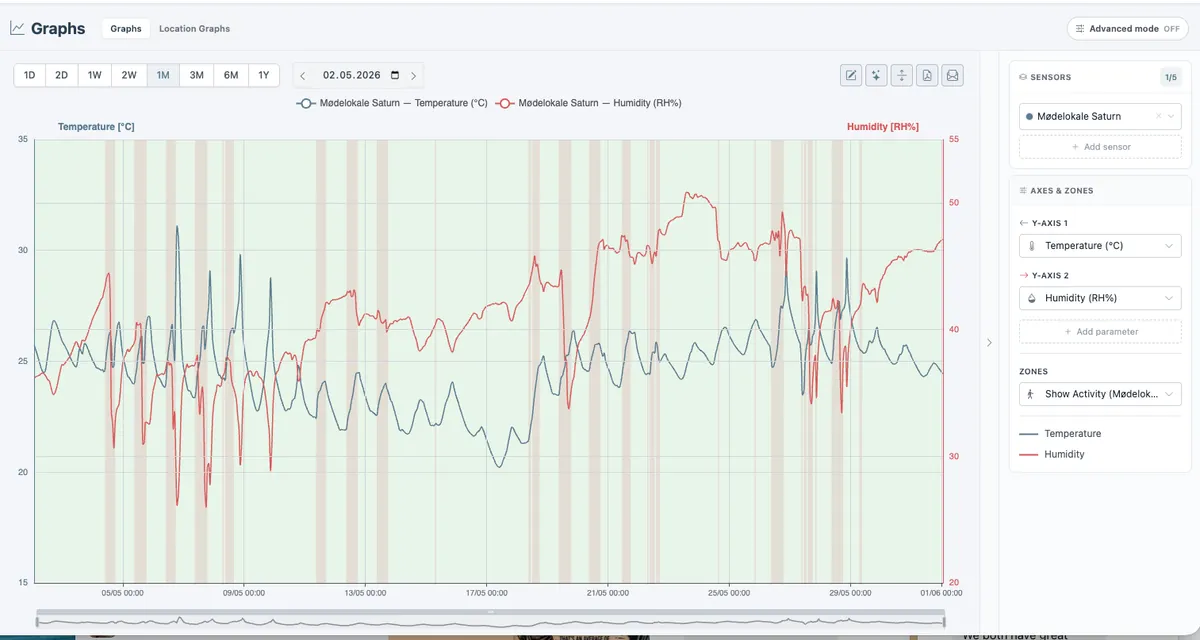
Click Analysis and you can see how the index has developed over time, set against temperature and humidity, and you can choose periods from 30 days up to three years — though only the periods the sensor actually has history for.
The index is also available where you are looking anyway: as a fixed column in the preservation sensor list, as a selectable parameter on the map and the floor plan, as a criterion in the building list, as a status tile on the dashboard, and as a daily column in the CSV export if you want to do your own calculations. When the question is who is responsible for the mould, a few weeks of this data can settle it: SKADE-teknik used it to show a housing association that the building was sound and the cause lay in heating and ventilation habits.
What the model cannot do
It cannot see mould. It calculates whether the climate has supported growth, from the temperature and humidity of the air where the sensor hangs. If mould is already growing behind a cupboard because of a leaking gutter, the model will not pick it up unless the air in the room reflects it.
Nor does it know surface temperatures. A cold external wall can have far higher relative humidity in the boundary layer than the room air does, and that is where growth begins first. A rising index is therefore a reason to go and look — not a definitive list of where there is mould and where there is not.
Finally, it is a model. It is built on laboratory trials with building materials and describes what is likely under the conditions measured. It does not replace a building survey or sampling.
If you want to understand the humidity parameter itself better, humidity monitoring is here. And if you want to see mould alongside the other preservation analyses, preservation monitoring is here.