Here is the quick overview for anyone who has been told the collection has to sit at 50% relative humidity — and who suspects that answer is too simple for the building you actually have.
EN 15757 is the European standard for climate in the conservation of cultural heritage, and its most important point is counter-intuitive: it is not the level that causes mechanical damage to organic materials, it is the fluctuations. Wood, canvas, paper and textiles take up moisture and give it off again, swelling and shrinking as the humidity changes. If that happens quickly and often enough, you get the cracking, the flaking, the delamination and the warping. A steady climate at 58% is better for a wooden sculpture than one that swings between 45 and 60 every week, even if the average looks tidier.
The object is acclimatised to the room it stands in
The second point follows from the first, and in practice it matters just as much.
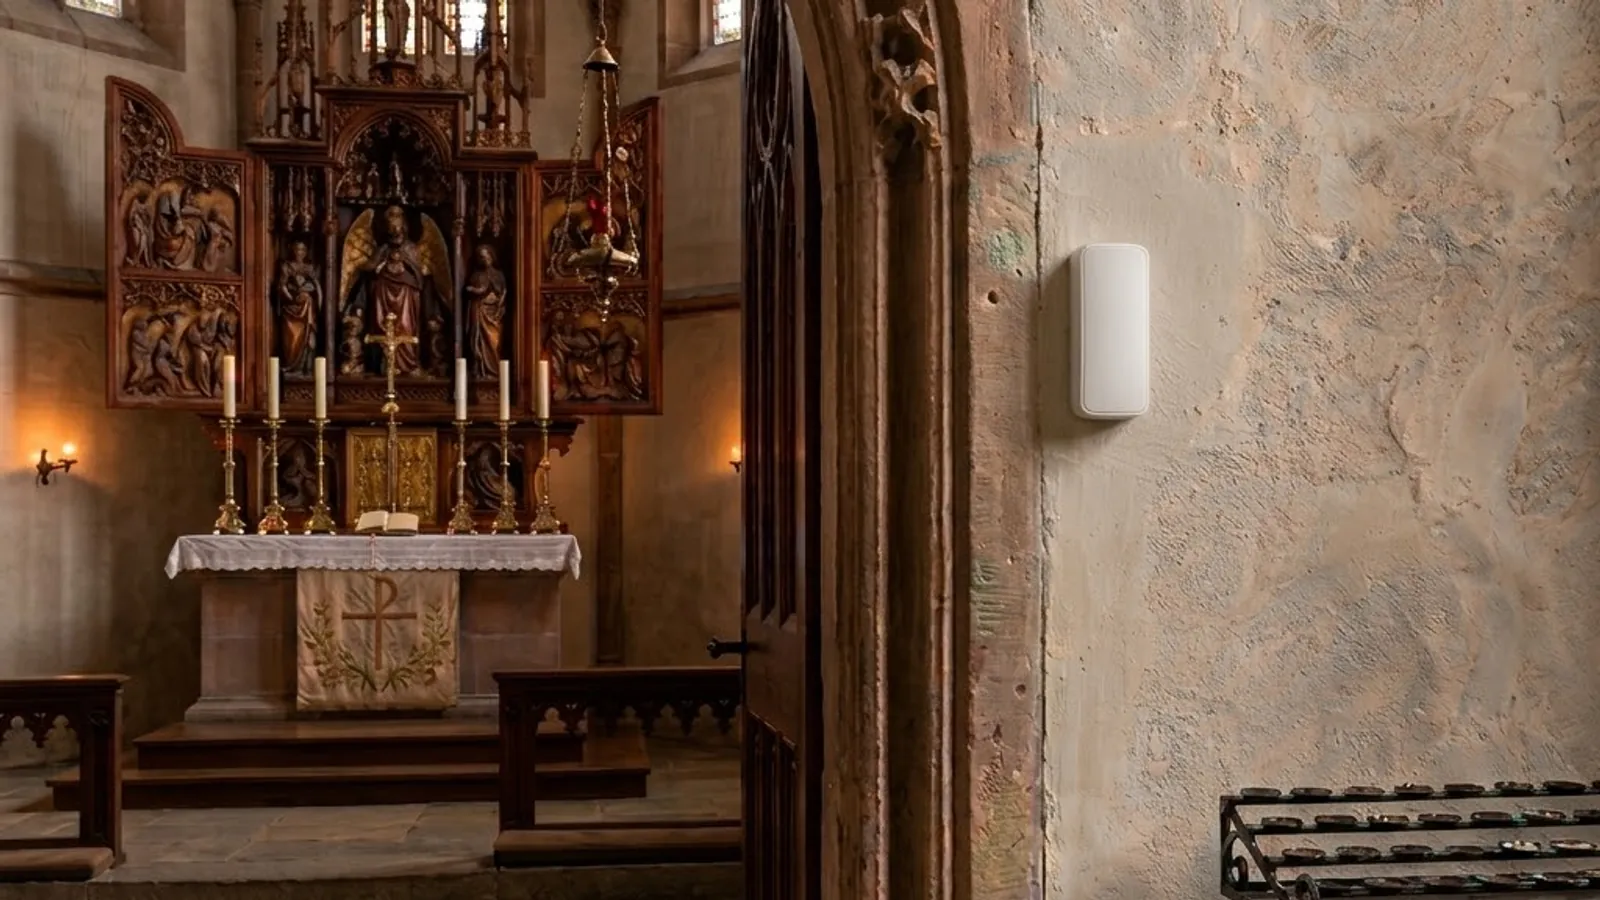
An object that has stood in the same church for a hundred years has found its equilibrium with that particular room. The material has settled, and whatever stresses it might have released were released long ago. If you suddenly ‘improve’ the climate to a textbook ideal, you force the material through a new movement — and that movement is precisely what the standard warns against.
That is why EN 15757 does not measure against a fixed ideal. It measures against the room’s own historical climate. The question is not ‘are you at 50%?’, but ‘is the room behaving the way it usually does?’.
How the history becomes a safe band
We have built all of it into Preservation in RoomAlyzer Air, and the calculation is simple enough to explain in a meeting:
- A daily mean of the relative humidity is calculated across the past 365 days.
- From that, a seasonal baseline is derived as a 30-day centred moving average. The baseline moves slowly through the year and so captures the natural seasonal rhythm — a damper autumn, a drier winter.
- A safe band is placed around the baseline: the baseline plus or minus the fluctuation the material can tolerate.
The width of the band depends on what is in the room:
| Material category | Permitted fluctuation | Examples |
|---|---|---|
| Robust | ±10 %RH | Stone, metal, glass |
| Medium | ±7 %RH | Canvas, paper |
| Sensitive | ±5 %RH | Wooden panel, inlaid and polychrome wood, historical objects |
The category is set per sensor under Administration → Fluctuations. EN 15757 accepts, in principle, any fluctuation below ±10 %RH, so the wide band is the standard’s upper limit, while the narrower bands are deliberately conservative choices for vulnerable collections.
An honest note on the method: in its full form, the standard derives the band from the room’s own fluctuations, marking the 14% most extreme days as a risk through the 7th and 93rd percentiles. RoomAlyzer instead uses a fixed, material-based band around the same baseline. It is easier to understand and easier to compare across rooms — but it is an approximation, not the standard’s percentile method, and we would rather say so plainly than leave it unsaid. With RoomAlyzer Air, we want to give you a straightforward solution where you know exactly where you stand when it comes to standards and indoor climate.
The three statuses
| Status | Meaning |
|---|---|
| Stable | At least 90% of the past 30 days fell inside the safe band |
| Stress | Below 90% — the objects may be taking damage |
| Learning | The baseline is still being built |
Learning deserves an explanation, because it confuses new users. At least 45 days of data are needed before a safe band is shown at all. And a band only counts as established once there is at least a full year of data, because that is what gives a complete seasonal profile with both summer and winter. A sensor put up in November does not know the room’s summer yet, and a safe band built on winter data alone will be misleading when spring arrives.
It is a slow feature, and that is deliberate. Preservation is measured in years, not days.
How to use it day to day
In RoomAlyzer Air, the overview page under Preservation → Analyses → Fluctuations lists every sensor with its status, deviation and climate score, where the score is the proportion of the past 30 days inside the safe band. Click through to the analysis and you get the humidity curve drawn on top of the baseline and the band, so you can see when it broke out and by how much.
The fluctuation status is also available as a column in the sensor list, as a selectable parameter on the map and floor plan, as a criterion in the building list, and as a status tile on the dashboard — so it can be followed where you are already looking.
If you would rather be told than go looking, there is an alarm that fits the logic: the Bizot fluctuation alert responds to the daily humidity swing — the difference between the highest and the lowest value — and only sends a message once the limit has been exceeded for a number of consecutive days that you set yourself. One message about a persistent problem, rather than a message about every single bad day.
One last thing worth knowing: a sensor moved to another room destroys its own safe band, because the history describes the old room. The preservation report therefore stops if the period spans a move, and tells you which sensors are affected.
If you want to see fluctuations alongside the other preservation measures, preservation monitoring is here. And if it is the humidity parameter itself you are after, humidity monitoring is here.