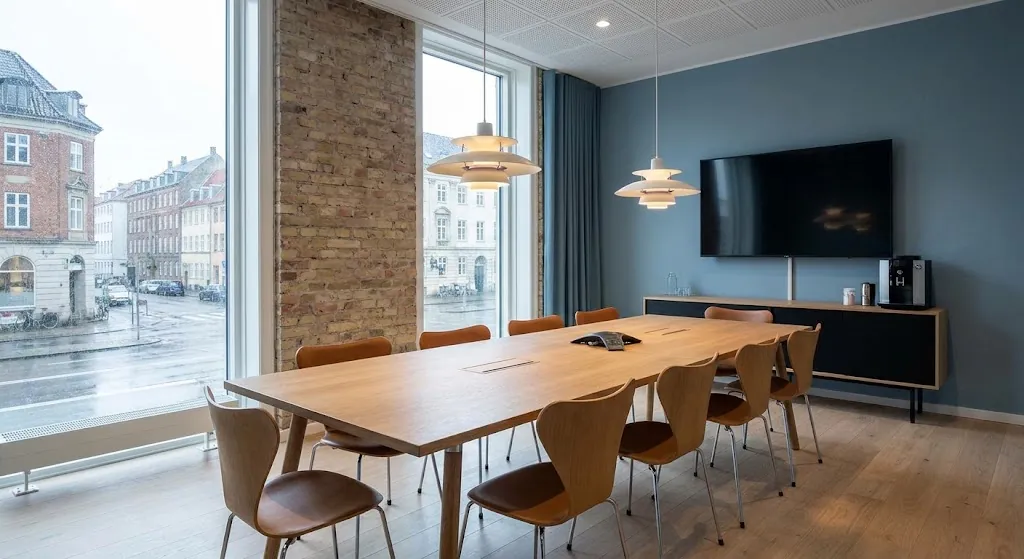
If you work in property operations and facility management, you may recognise this one: you are told there is never a meeting room free — while you walk past half-empty rooms every day.
Right-sizing is about comparing the supply of meeting rooms with the demand for them: how many rooms do you have in each size, and how large are the meetings that actually take place? When the two do not match, you get the paradox everyone knows — a shortage of rooms and empty chairs at the same time. That is why we built Space management in RoomAlyzer Space, which makes the comparison and the analysis for you and gives every room a recommendation: could be smaller, about right or often too small.
Why shortage and overcapacity are the same problem
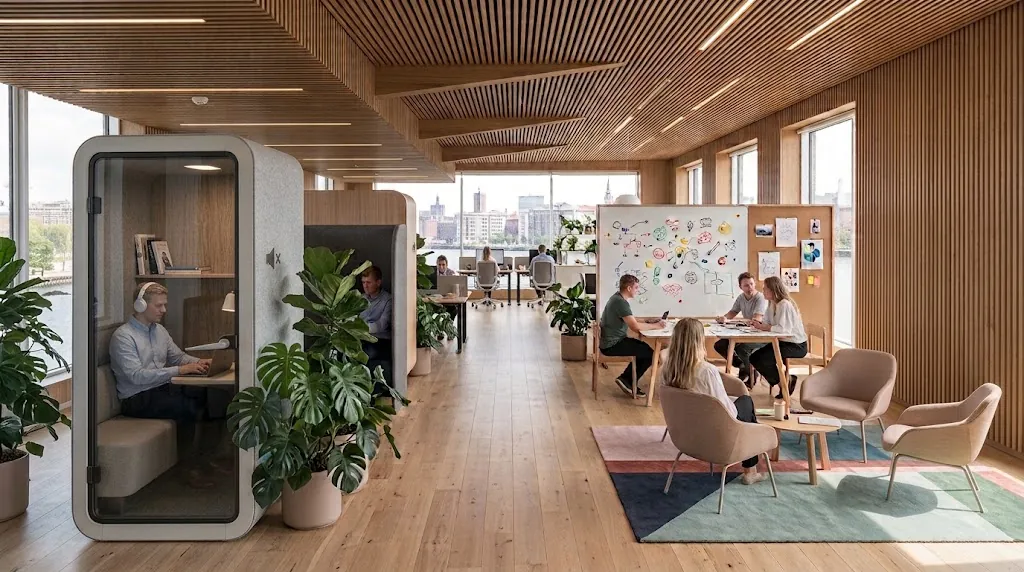
The typical office building is laid out around an idea of what a meeting looks like. Large rooms for department meetings, a couple of medium ones, and perhaps a single small one. Then the large rooms get booked for two-person conversations, because they are free and because nobody is penalised for taking more space than they need.
The result is that capacity is locked up in rooms used at a fraction of what they can hold. And because meetings like that are frequent, the large rooms are occupied all the time — even though the number of people in the building would fit comfortably.
The answer is rarely more square metres. It is usually a different distribution: splitting one large room into two or three small ones, or putting up a couple of phone booths where the two-person conversations can happen.
What it takes to measure this
There is a distinction here that decides what you can get answers to.
Rooms with a sensor per seat know the actual number of people present at the same time. They can therefore be used for everything: meeting size, wasted seat hours and the whole right-sizing analysis.
Rooms with only a Motion sensor (PIR) know whether the room is occupied or free, but not how many people are in it. They count towards how often and when a room is used, but not towards the size analysis — because an occupied room may hold two people or twelve, and that difference is the entire point. The pages mark clearly which rooms are PIR rooms, so you do not draw a conclusion the data cannot carry.
The suite: six questions, six pages
The meeting room analyses in RoomAlyzer Space are built as one connected suite, where the filters for location, tags, size and office hours follow you when you move from page to page.
- Pulse: The overview: average utilisation, number of meetings, average meeting size, wasted seat hours and total capacity — plus automatic insights such as ‘this room is never used to capacity’ or ‘this room is often full’. It is the place to start.
- Rhythm: Answers when the pressure is greatest. One heatmap across weekday and hour shows the share of rooms in use, and another shows the number of concurrent meetings — the demand. If the pressure sits between 9 and 11 from Tuesday to Thursday, the problem may not be the number of rooms but the meeting culture.
- Right-sizing: The comparison of supply and demand itself, with a recommendation for each room.
- Meeting culture: Describes how you meet: the distribution of meeting lengths and start times, back-to-back meetings, dead time between meetings, short meetings and solo meetings. This is often where the cheapest solution is hiding — if every meeting starts on the hour and runs for an hour, demand is squeezed into peaks that need not be there.
- Ranking: Compares the rooms on utilisation, number of meetings and hours used. If you have entered floor area and annual cost under Administration, it can also show cost per hour used — the figure that usually ends the discussion about whether a room should be reconfigured.
- Scenario: The tool for the decision. You build a hypothetical mix of rooms — for example: the large room is split in two, and two phone booths are added — and run it against your actual historical meetings. The result shows what share of the meetings could have gone ahead, how many would have been left without space, and how much floor area and cost is freed up.
That is the analysis that turns a hunch into a proposal. You no longer suggest a refit because it feels right — you can show that 96% of the past six months’ meetings would have fitted in the new mix.
Alongside: the everyday gain
Beyond the analyses there is one view that solves an everyday problem: Available rooms is a live board showing which meeting rooms are free right now. Each room appears as a card — green for free, red for occupied — and for occupied rooms it gives an estimate of when the room typically becomes free again, based on the average meeting length. The board can be sent to a screen in reception or by the lift with a password-protected TV link.
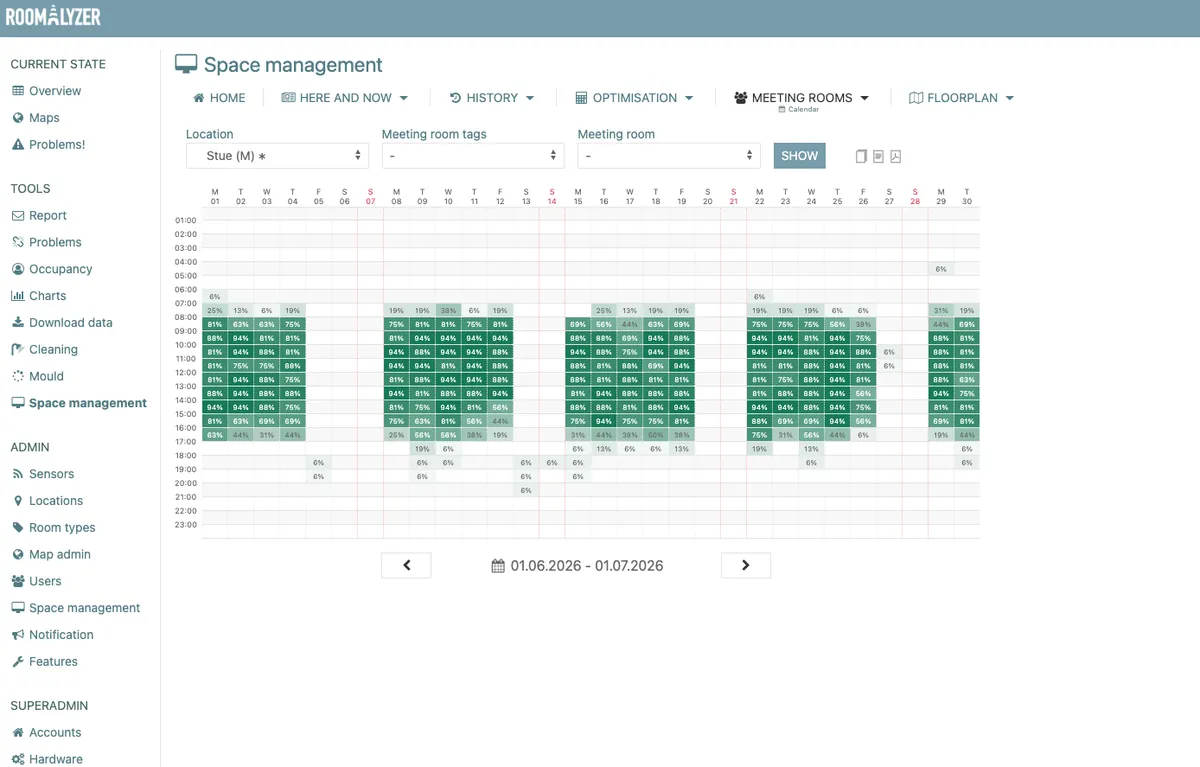
The monthly calendar for meeting rooms is the counterpart to the one for desks: a heatmap across hour and day. It has a noise filter worth knowing about — during the day a room needs at least 15 minutes of continuous use before an hour counts as used, and at night 45 minutes. Otherwise a cleaning trolley at two in the morning would colour in a whole hour.
If you want the full picture with desks and floor areas, Space Management is here.