Your budget stretches to doing something about three rooms this year, and as the operations manager you have to justify why the money went to those three in particular — even though there were more complaints and more rooms on your list. Sound familiar?
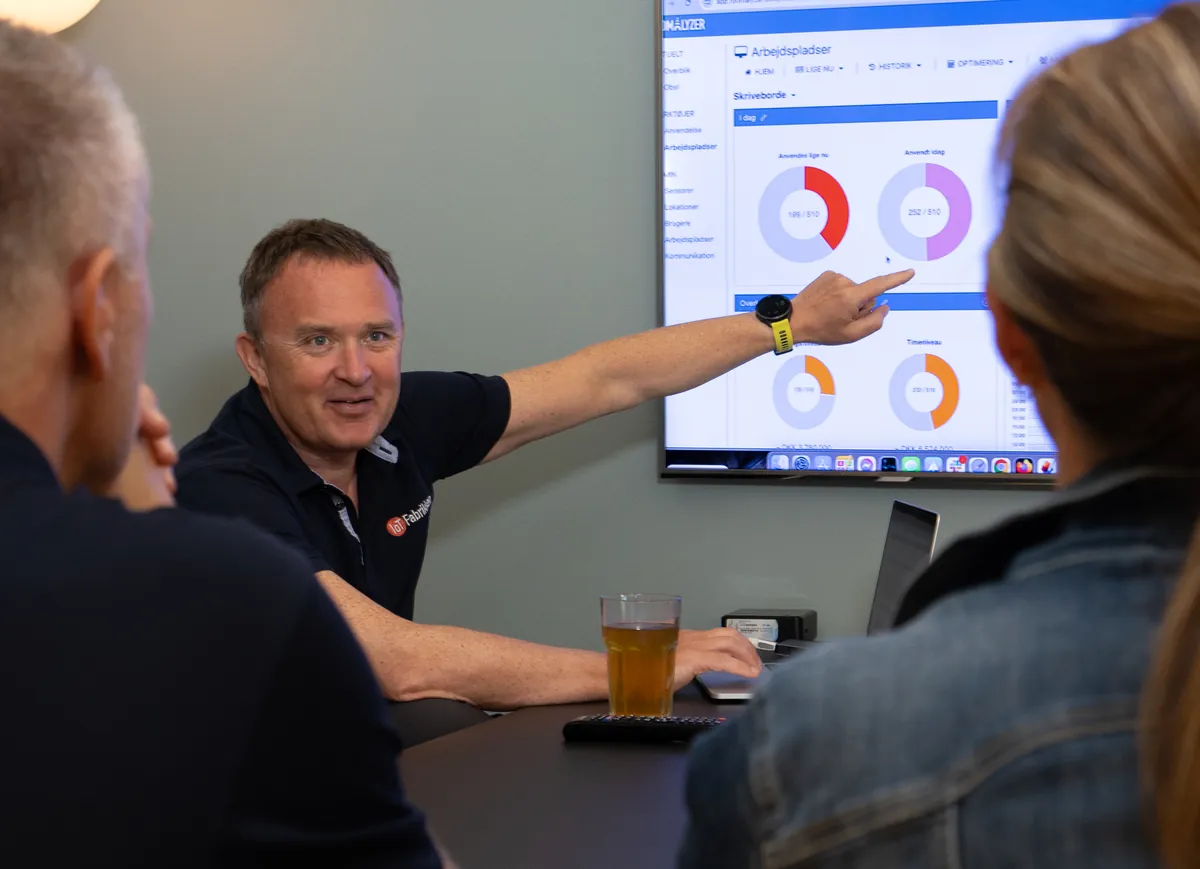
A deviation is time a room has spent outside its thresholds. The deviation analysis in Indoor climate in RoomAlyzer Air gathers all those hours and answers three questions a single chart cannot: how much of the time the room sat outside the band, which rooms are worst, and when in the day it happens. That is the difference between knowing there was a problem and knowing where the problem lives.
From a single reading to a pattern
Everyone knows the picture: a chart with a neat peak above the red line. It proves it happened. It does not tell you whether it happens every day, whether it is worse in room 2.14 than in 2.16, or whether it is really about the two hours after lunch.
And those are the questions decisions rest on. Whether you fit solar shading, change the ventilation’s operating hours or move a group to a different room, knowing that there have been breaches is not enough. You need to know how many hours, when, and where.
The basis is the thresholds the room has already been given. If the sensor has a scenario, the scenario’s figures apply, including the switch between summer and winter. Otherwise the sensor’s own thresholds are used. That means the deviation analysis automatically measures an archive against archive requirements and a meeting room against comfort requirements — without anyone having to remember the difference.
Status: how much of the time was fine?
In RoomAlyzer Air we have set it up so that the first page, Deviations → Status, splits the time into three parts for the chosen parameter and period:
- Blue — below the threshold (too cold, too dry).
- Green — within the threshold.
- Red — above the threshold (too warm, too humid, CO2 too high).
You choose a parameter and a period from 24 hours up to six months, and you can view it for a single sensor or for a whole location. That gives you a figure you can put into a recommendation: ‘the office wing stayed within the temperature band for 91% of occupied hours in August’ is a different kind of sentence from ‘there were some warm days’.
The View 24-hour distribution button opens what is often the most useful view: a day split into 24 hours, so you can see when in the day the deviations fall. If they sit from 13:00 onwards, it is the sun. If they sit first thing in the morning, it is more often the night setback or a system that starts too late. If they are scattered, it is occupancy that varies.

Which sensors: the ranking of the worst rooms
The second page, Deviations → Which sensors, ranks the rooms against one another. You decide what ‘worst’ should mean:
- Longest deviation — the room with the longest unbroken period outside the threshold.
- Largest deviation — the room that has been furthest from the threshold.
Those are two different problems. A room sitting 0.5 degrees above the threshold for twelve hours calls for something other than a room that hits 31 degrees for an hour and a half. The ranking can be expanded from location down to the individual sensors, and from there you can open the quick chart to see exactly what happened.
From analysis to action
The analysis tells you what has happened. Three things make it useful going forward.
-
Notifications: They sit as a sub-item under Deviations, and that is no accident: once you have seen the pattern, you put an alert on it. You choose sensor, parameter, threshold, sensitivity and recipients, and the system sends an email or a text message when it happens again.
-
Insights: Under the AI assistant gathers the most striking findings automatically — the longest unbroken breach and the worst locations — as cards you can click straight through into Deviations from. The figures come from the last calculation, and you can press Update now to have them worked out again.
-
Reports: Turn it into documentation. The location report gathers the period for a whole address into a PDF you can download now or have sent to you every Monday morning.
One detail worth knowing: the deviation analysis stays with indoor climate. Outdoor sensors are kept out, so a sun-baked outdoor sensor does not become ‘the worst room’, and water detectors, pipe temperature sensors and space sensors are not included either. And if a sensor has moved to a different room part-way through the period, it is worth checking in the chart whether the jump belongs to the room or to the sensor.
If you need to set the thresholds properly first, scenarios and thresholds are covered here. If you would rather be told than go looking, notifications are explained here.