
Building dashboards – your data, your way
A good dashboard turns sensor data into something you can act on at a glance. RoomAlyzer gives everyone in your organisation the information they need, in the form they need it: from a personal overview on a laptop to a live display on the wall. And you set it up yourself, without involving IT.
Build it yourself in minutes
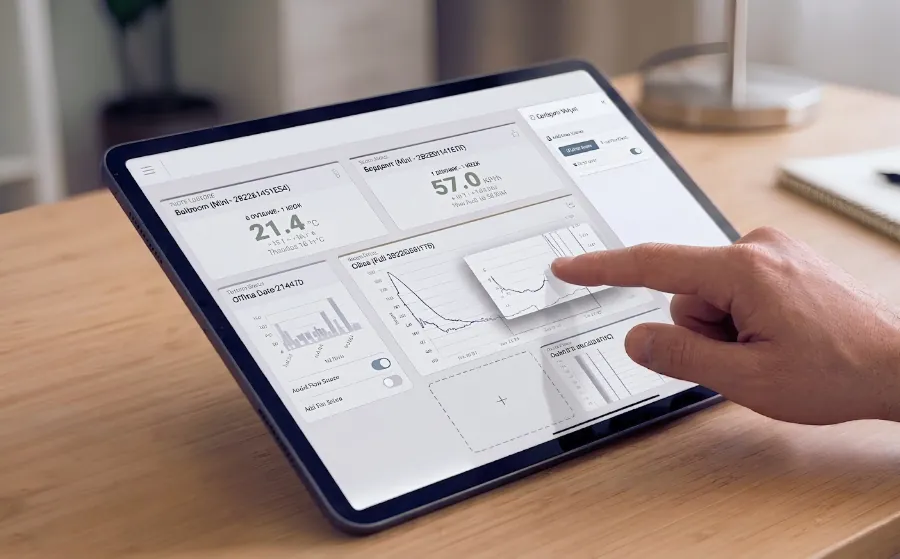
There is no fixed layout. You choose what to show with five simple widget types: a big KPI number, a live reading, a graph, a top list, or a heatmap. Adding one is a guided three-step process with no training required, and your layout saves automatically as you go.
What you see, by solution
Each solution has its own ready-made operational view, so you always know where you are:
- RoomAlyzer AirIndoor climate
Live temperature, humidity, and CO₂, with sensor activity indicators that pulse as readings come in. Includes a parallel view for preservation with conservation-specific measures for museums, archives, and churches.
- RoomAlyzer SpaceSpace management
See how your desks, rooms, and zones are really used: live occupancy and heatmaps that reveal patterns over time. It is the data that tells you where there is spare capacity, which meeting rooms sit empty, and where a free desk is right now.
- RoomAlyzer WaterWater detection
An operational cockpit showing active alarms, silent sensors, and the health of your whole sensor fleet in real time, refreshing automatically every few seconds, so a leak is never missed.
Additional energy view: waste shown in currency and CO2 and efficiency broken down per location.
Dashboards for you, and dashboards for everyone
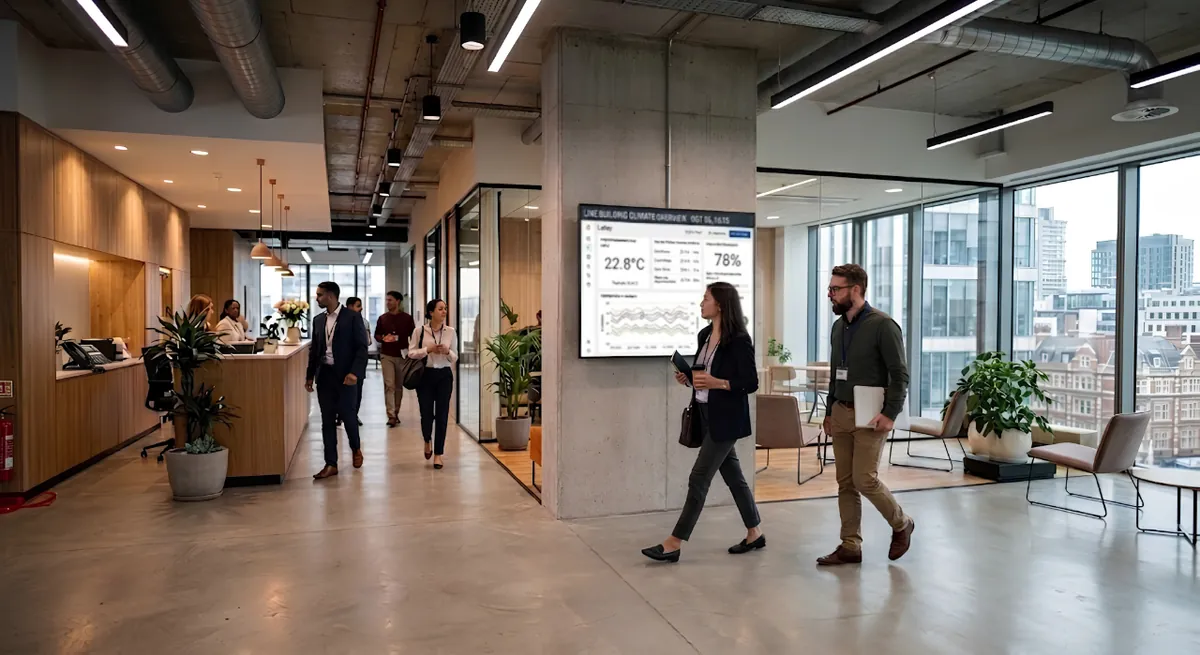
For you and your team: build as many dashboards as you like for different roles (a management overview, technical monitoring, a department view) and switch between them in seconds. Data is always scoped to your organisation and respects each user's access, so everyone sees exactly what they should, and nothing they should not.
For everyone in the building: any dashboard or live floor plan can be shared on a wall screen via a password-protected link: no login, just a URL and a password. Show colleagues and visitors how busy the canteen is, where there is a free desk as they arrive past reception, or which meeting rooms are free, so they can sort themselves out at a glance.
You choose what goes on a public screen: maybe space data is something you are glad to share, while indoor climate data is something you would rather keep to the operations team. You can run several screens from the same building, each with its own password, so the lobby and the operations centre show different views.
Also in the platform
See the platform with your own buildings
Book a short demo, or talk to sales about dashboards, reports, security and API access for your sites.